
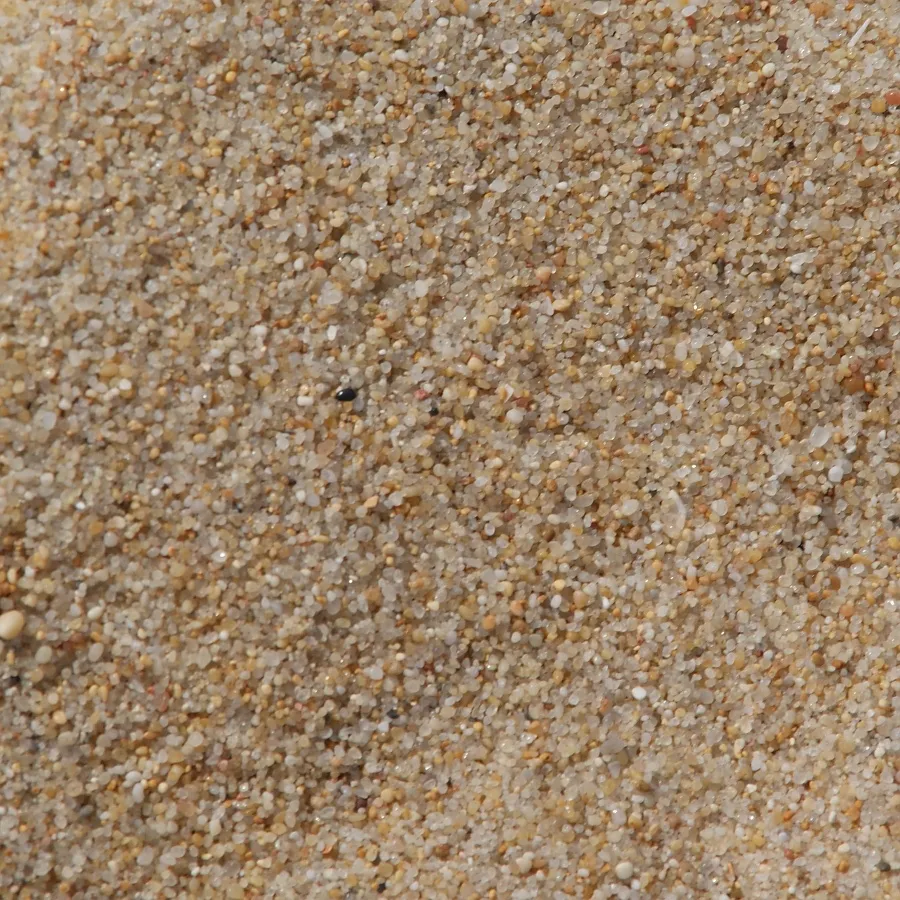
A single step pressed into damp sand can hold time. If that sand was buried soon after, each grain began storing a quiet record of radiation, a record that builds while the grains lie in darkness. Years later, a scientist can take a few teaspoons of that sand into a darkroom, shine a controlled light on the grains, and read how long they have been buried. In the right conditions, a footprint is not only a trace of movement. It is a date.
The method behind that date is optically stimulated luminescence, often shortened to OSL. It sits in a family of techniques known as luminescence dating. Archaeologists and Quaternary geologists use it to date the last time mineral grains, usually quartz or feldspar, saw sunlight or were heated. The time window fits human and environmental history well: from a few decades to hundreds of thousands of years, depending on the mineral, the environment, and the instrument. It works on the materials most of us step over without noticing. Windblown sand, river silts, mud on a cave floor, a dune slipface that crept across a valley, a levee built by a flood. When pottery or bricks are heated, a close cousin of OSL called thermoluminescence can date the last firing. But for footprints in buried sand, dunes, and many sediments, OSL is the main tool.
This article translates the physics into everyday language and traces the whole path from a field sample to a number on a lab report. It explains why sunlight resets a clock, how darkroom instruments count tiny flashes of light, and why a date is always a ratio. It shows where OSL excels, where it struggles, and how researchers combine it with other evidence to build firm timelines. The aim is simple: after reading this, you should be able to look at a sand layer, a dune ridge, or a buried surface and say with some confidence whether OSL could date it and how.
What exactly is OSL dating?
OSL dating measures how long mineral grains have been buried in the dark. Quartz and feldspar have crystal structures with defects that can trap electrons. Natural radiation from trace amounts of uranium, thorium, and potassium in the surrounding sediment, plus a small cosmic-ray contribution, knocks electrons loose in the crystal lattice. Some of those electrons fall into the defects, called traps, and stay there. The longer a grain sits in the dark, the more trapped electrons accumulate.
When you shine a specific wavelength of light on those grains in the laboratory, the trapped electrons are released and recombine. That recombination emits faint light, luminescence, which a detector counts. The intensity of that light is proportional to the amount of trapped charge, which in turn is proportional to how long the grain was buried, scaled by the local radiation environment. The buried time is the age.
One sentence summary: OSL measures time since the last bright exposure to light. If sunlight had reached the grains before burial, the slate was wiped clean. Burial in darkness started the clock.
Why sunlight resets the clock
Quartz and feldspar traps are shallow enough that bright light can empty them. Think of the crystal like a building with many rooms. Radiation tosses electrons into those rooms. Sunlight is the master key that opens most of them. A good, strong exposure on a river bar, a dune surface, or a beach empties enough traps to reset the signal close to zero. If burial happens soon after, the clock starts fresh.
This is why footprints and windblown sands are so valuable. People walk on exposed ground. Wind sorts and spreads sand in open sunlight. Both processes naturally zero the grains before burial. A layer of mud deposited in darkness inside a cave, by contrast, might not have seen any light at all. That does not kill the method, but it does add complexity, because some grains may carry leftover signal from previous burial. We will return to that problem under partial bleaching.
A pocket guide to the physics, without the math
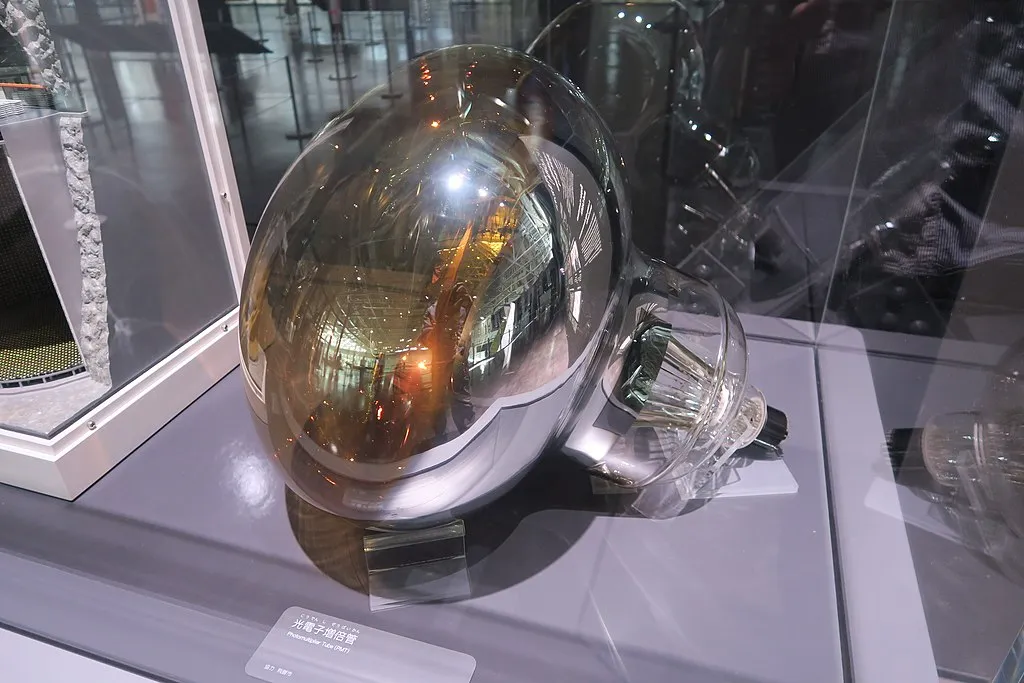
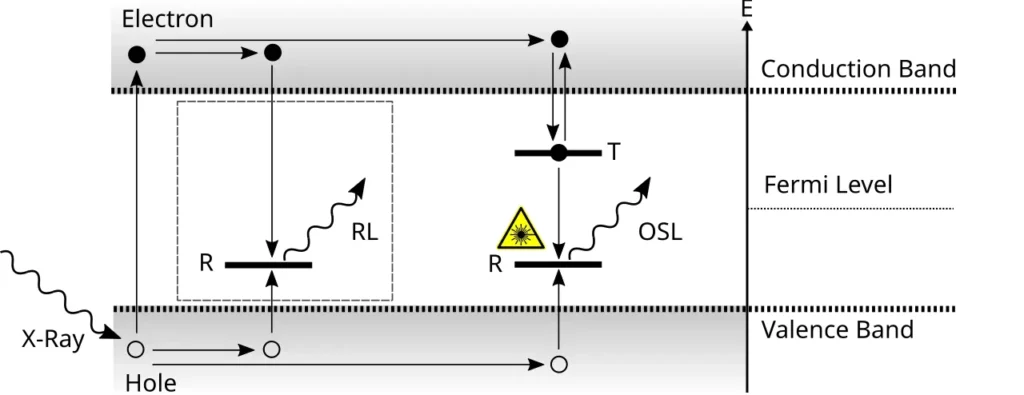
Mineral grains have a valence band, where electrons normally sit, and a conduction band, where electrons are free to move. Ionizing radiation bumps some electrons into the conduction band. Defects in the lattice act like potential wells where electrons can fall and get stuck. Over time, more electrons accumulate in these traps. Light at specific wavelengths lifts electrons out of traps. When they recombine at luminescence centers, they emit photons that a photomultiplier tube can detect.
Two concepts matter most.
Equivalent dose (De). The amount of radiation dose that the grain’s luminescence signal corresponds to. This is what the luminescence measurement gives you, in units of Gray, which is joules per kilogram.
Dose rate (Dr). How much radiation the grain receives per year from uranium, thorium, potassium, and cosmic rays, adjusted for water content and shielding. This is measured separately by field dosimeters, gamma spectrometry, or geochemical assays.
The age is De divided by Dr. No elaborate equation is needed to remember the core idea. Age equals stored dose divided by dose per year.
From shovel to date: how OSL sampling and measurement work
OSL stands or falls on careful sampling and preparation. Light is the enemy of the stored signal, so the first rule is simple. Do not let white light touch the grains you plan to measure.
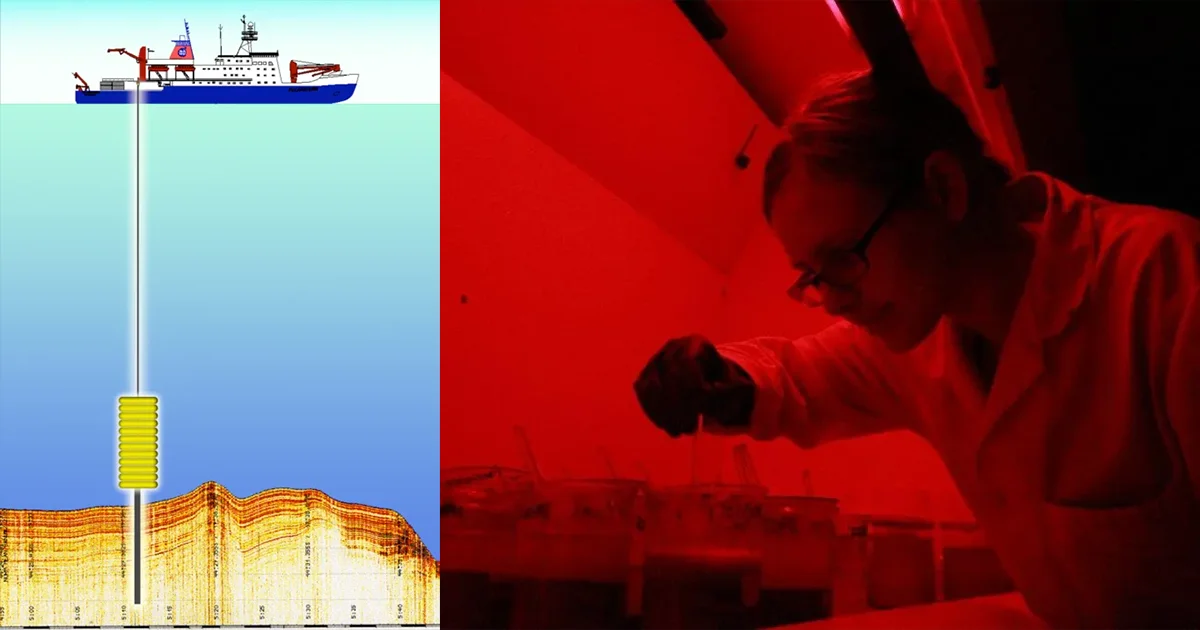
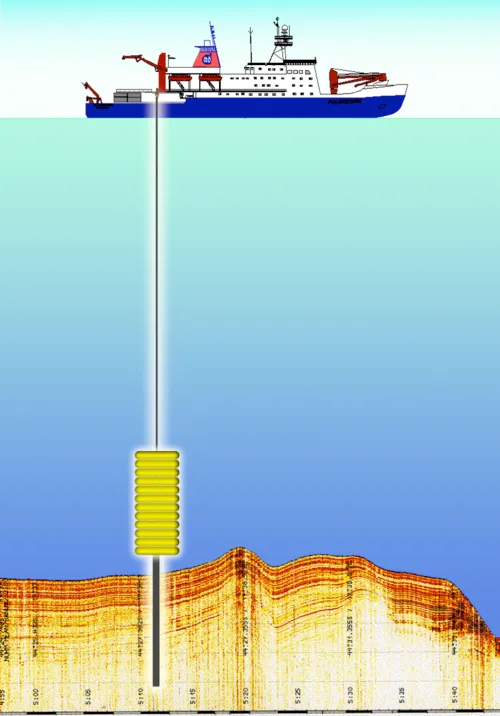
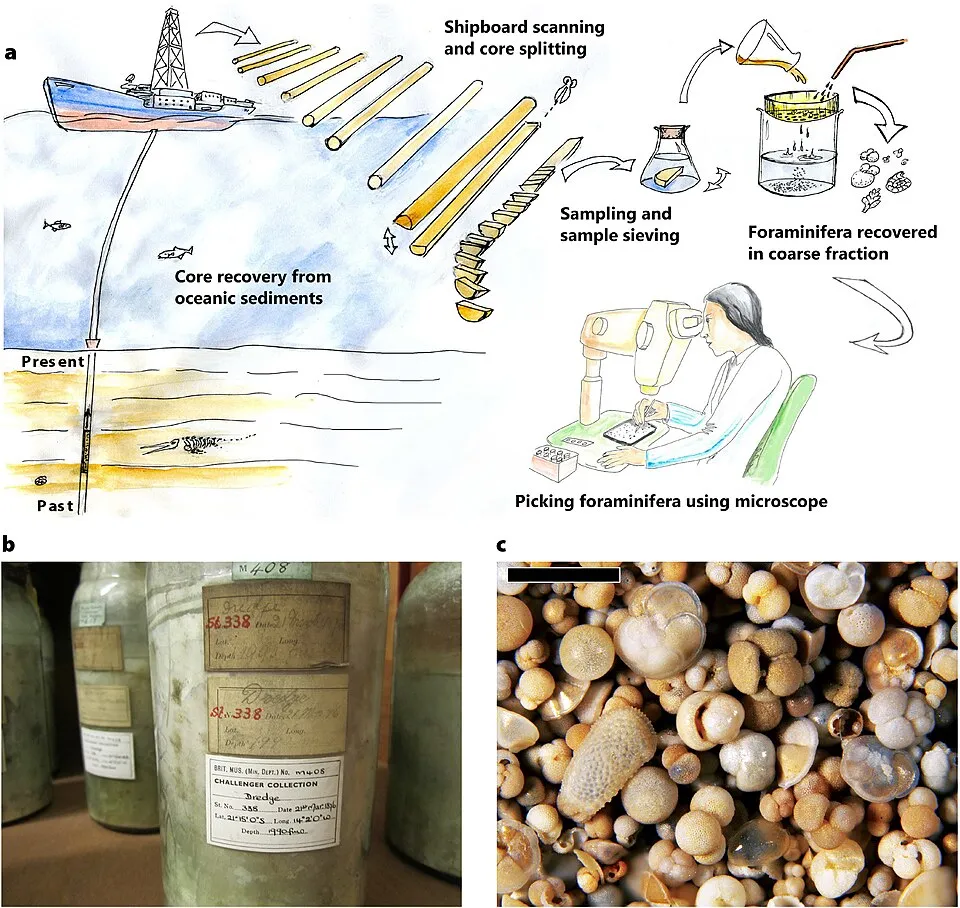
Field sampling. In a vertical exposure, a technician taps an opaque metal tube into the target layer, caps both ends, and wraps the tube tightly. In cores, the lab will open the core in low amber light and sample from the center. For dunes and river deposits, the ideal place to sample is a clean, freshly scraped profile that shows clear layers and no root holes or burrows.
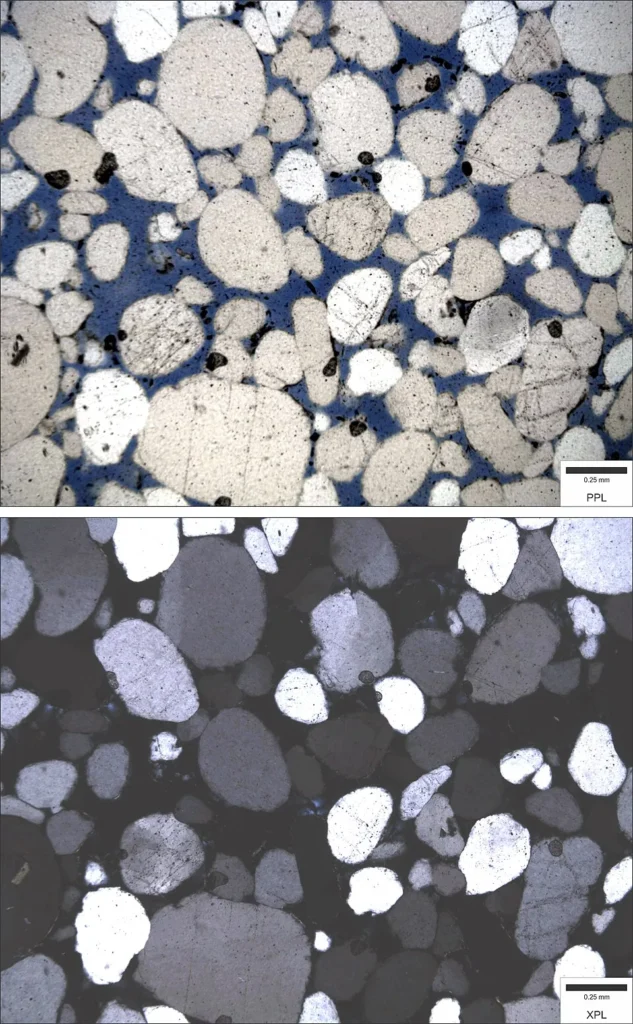
Darkroom work. Inside the lab, technicians work under dim orange or red light that does not empty the traps. They open the tube, remove the outermost sediment, and isolate the target grains, typically quartz at 90–250 micrometers or potassium feldspar at similar sizes. Acid and density separations remove carbonates, organics, and heavy minerals.
Mounting grains. Grains are mounted on small stainless discs or cups. For “aliquot” measurements, thousands of grains are spread in a thin monolayer on a disc. For single-grain OSL, grains are put in a perforated plate so the instrument can read each grain separately.
Stimulation and detection. The reader stimulates quartz with blue or green light, feldspar with infrared, and measures the emitted photons with a photomultiplier tube. The instrument cycles each aliquot or grain through a sequence of known radiation doses and light stimulations to build a growth curve, then interpolates the natural signal to find De.
Standardized instrument platforms and protocols have made this workflow widely repeatable. The most common automated reader in luminescence laboratories is the Risø TL/OSL system, which handles stimulation, heating, and photon counting in a controlled environment. Many labs follow its Single Aliquot Regenerative dose, or SAR, procedure to obtain De values consistently. For a clear, practical sampling guide, Utah State University’s luminescence group publishes illustrated instructions for collecting sand-sized sediment in opaque tubes, including how to seal, label, and ship specimens.
What the instrument actually measures
The instrument steps through a routine. First, it stimulates a mounted aliquot or grain with light, records the luminescence, and notes it as the natural signal. Then it gives the same aliquot a known laboratory radiation dose, stimulates, and records the response. It repeats this for several doses. The responses plot as a growth curve, a dose-response relationship. The natural signal falls somewhere on that curve. The equivalent dose De is the x-coordinate on the curve where the luminescence equals the natural signal.
Because a single aliquot may contain a mix of grains with different burial histories and sensitivities, the SAR method includes test doses and sensitivity correction steps after each exposure. Those correct for changes in the grain’s response as the sequence proceeds. The end product for one aliquot is a single De value. The end product for one sample is a distribution of De values across many aliquots or many individual grains.
Age, with uncertainties: turning dose into years
Once De is in hand, the lab calculates Dr, the dose rate. That number combines four components.
Radioelements in the sediment. Uranium, thorium, and potassium contribute beta and gamma radiation. Their concentrations can be measured by gamma spectrometry or by geochemical analysis of the sediment.
Cosmic dose. A small contribution from cosmic rays, corrected for latitude, altitude, and burial depth.
Water content. Water attenuates radiation. The wetter the sediment during burial, the lower the effective dose rate. Labs correct for water content using measured values or reasonable ranges based on the sediment and site history.
Internal dose. Feldspar grains contain potassium, which adds a dose from within the grain. Quartz has negligible internal radioactivity, which is one reason many labs prefer it.
The age equals De divided by Dr. Uncertainty comes from both terms. The reported result is typically a central value plus or minus a one-sigma error, often in the range of 5 to 10 percent for well-behaved samples.
What about partial bleaching, and why single-grain measurements matter
Not all grains see enough sunlight before burial to fully reset their clocks. A river may carry silts at night, a dust storm can settle under cloud cover, a cave floor can receive sediment in darkness. This leads to partial bleaching, where some grains read nearly zero at burial and others carry leftover signal. If you measure many grains together on a single aliquot, the leftover signal from a minority can bias the De higher, which makes the age too old.
The fix is both statistical and instrumental.
Single-grain OSL. By measuring one grain at a time, the lab can separate well-bleached grains from poorly bleached ones. De values from well-bleached grains cluster at the true burial dose.
Age models. Analysts use models tailored to the shape of the De distribution. The Central Age Model works when grains are fairly well behaved with modest scatter. The Minimum Age Model estimates the burial dose from the youngest subpopulation when partial bleaching is suspected.
Field judgment. Where possible, researchers sample contexts that are most likely to have been sunlit immediately before burial, such as dune crests, beach faces, or fresh channel bars.
- This combination often pulls a clean burial signal out of a complicated history.
Feldspar, anomalous fading, and pIRIR
Feldspar can extend the age range because it saturates at higher doses than quartz. Feldspar has a problem, though. Its trapped charge can leak at room temperature over time, a process called anomalous fading. If not corrected, fading can make ages underestimate the true burial time.
Several strategies handle this.
Fading tests. Labs can measure the rate of signal loss in the laboratory and correct the age accordingly.
pIRIR protocols. Post-infrared infrared stimulated luminescence sequences stimulate the feldspar at one infrared temperature, then measure a second, more stable signal at a higher infrared temperature. The higher-temperature signal often fades less and can provide more reliable ages for older samples.
Quartz remains the first choice when available. Feldspar offers a path where quartz saturates or is scarce, with appropriate corrections.
Limits and sweet spots: how old, how young, how precise
OSL usually works best from a few centuries up to about 100,000 to 200,000 years for quartz in many natural settings. The upper limit arises because the traps fill up and the luminescence growth curve saturates. Beyond saturation, more dose does not produce more signal, so De cannot be determined. Feldspar’s higher saturation levels, plus pIRIR, can push the limit several hundred thousand years further, depending on dose rates and instrument sensitivity.
At the young end, ages of a few decades are possible in high-dose-rate environments, or where single-grain methods catch very small De values with good precision. In practice, below about 100 years, measurement uncertainty, dose-rate variability, and the risk of incomplete bleaching can overwhelm the signal unless conditions are ideal. For the periods most archaeologists and Quaternary scientists study, from the late Pleistocene through the Holocene, OSL sits in a comfortable middle ground.
Precision depends on the uniformity of the burial environment, the quality of bleaching, and how many grains behave well in the reader. Good samples routinely yield errors under 10 percent. Challenging contexts can be worse, and smart field selection is often the difference between a crisp date and an ambiguous one.
Where OSL shines: dunes, river terraces, cave floors, and flood layers
OSL dates the burial of the sediment, not the manufacture of an artifact or the death of an organism. That makes it ideal for landscapes where the timing of deposition is the event of interest.
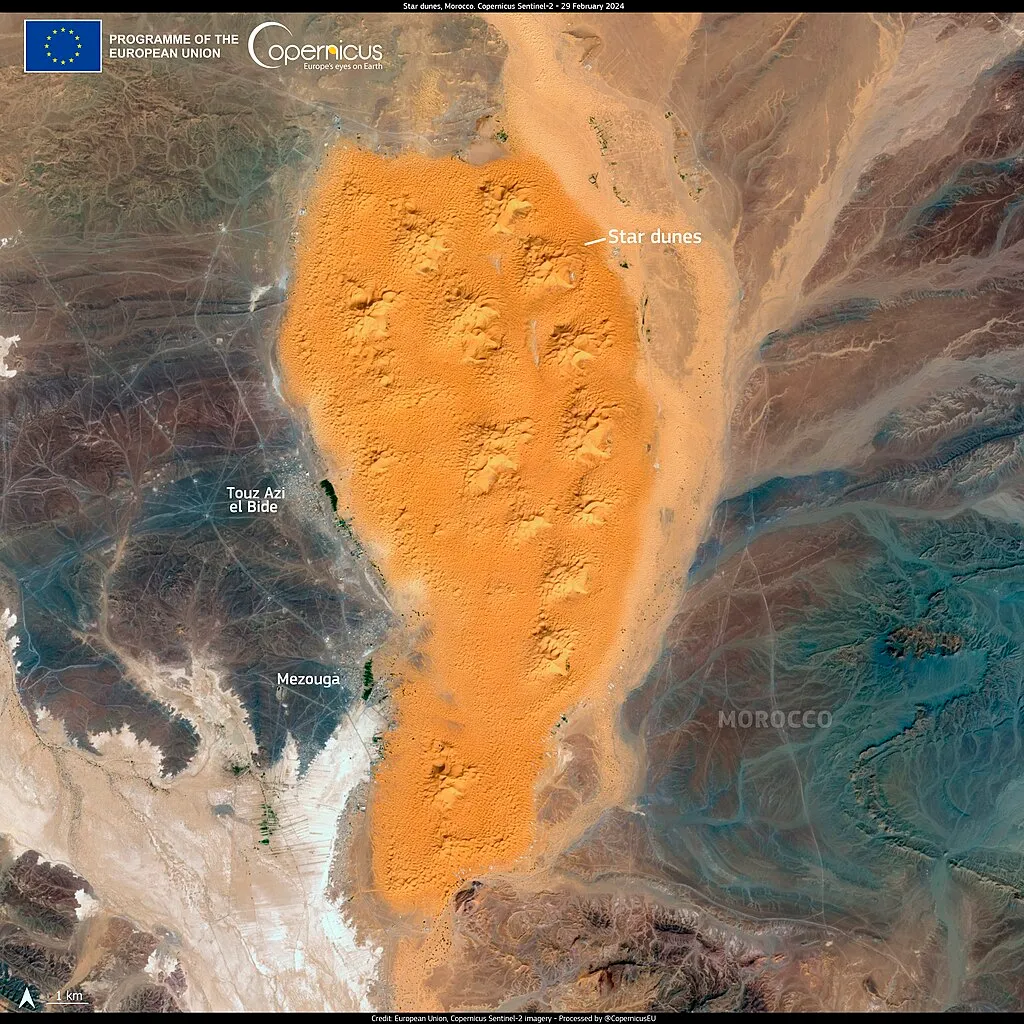
Dunes and aeolian sand. Windblown sands are thoroughly sunlit. Slipfaces build up layer by layer. OSL can time dune migration, dune-field stabilization, and episodes of aridity.
Loess and dust. Windblown silts, such as the great loess deposits of Eurasia and North America, track cold and dry phases. OSL can build high-resolution age models through thick sequences.
River systems. Channel bars, floodplain levees, and overbank silts are all candidates. OSL reconstructs terrace formation, avulsions, and flood histories.
Coastlines. Beach ridges, dune cords behind beaches, and storm washover deposits respond to sea-level change and storms.
Caves and rockshelters. Many archaeological sites sit on cave floors where mud and sand accumulated in darkness. With careful modeling for partial bleaching, OSL can date occupation surfaces and sediment pulses.
Tsunami and storm layers. Sharp, sand-rich beds interleaved with muds on coastal plains can be dated to establish recurrence intervals.
The method’s strength is that it dates the actual event of burial, rather than something that happened before or after. If a footprint pressed a dune surface and wind covered it quickly, that layer’s OSL age estimates the time of that walk.
How dose rate is measured, and why water matters
Radiation sources vary in space and time. A brick in a wall with potassium-rich feldspar has more dose than a clean quartz sand dune. A saturated floodplain stores less dose because water attenuates radiation. Labs handle this with a combination of measurements and assumptions.
Gamma spectrometry. A sealed sample can be measured for gamma emissions from uranium, thorium, and potassium decay chains. This yields radioelement concentrations that translate to dose rates.
High-purity germanium counting. Some labs use large detectors to measure samples, cores, or even whole blocks for gamma lines, which refines the dose calculation.
Geochemical assay. Inductively coupled plasma or X-ray fluorescence can estimate U, Th, and K if the sediment is homogeneous.
Cosmic dose estimation. Published formulas adjust for latitude, altitude, and depth. A meter of burial can halve the cosmic component.
Water content estimates. The dose rate is adjusted for how much pore space was filled with water during burial. Where moisture history is uncertain, labs use a range that expands the uncertainty on the final age.
These corrections are not arcane. They acknowledge that De is only half of the age equation. A precise De with a sloppy dose rate is no favor to the truth.
How we know the method works
OSL has been cross-checked against independent clocks for decades. In river terraces with interbedded charcoal, OSL ages line up with radiocarbon within errors when both are expected to date the same event. In dune fields stabilized by soils, OSL ages match soil development and tephra layers. In loess sequences, OSL ages track glacial and interglacial cycles in a way that agrees with paleomagnetic markers and volcanic ash chronologies. When OSL and another method disagree, the reason is usually understandable: partial bleaching for OSL, or reworked organic carbon for radiocarbon.
The instruments and protocols have matured in step with those checks. Automated readers deliver consistent light and heat. SAR and its variants enforce internal consistency on each aliquot. Single-grain measurements handle complex origin stories grain by grain. The result is a method that has moved from experimental to routine across dozens of laboratories, while still demanding care at every step.
Built out of a love for history, kept free from distractions.
Spoken Past is an independent project shaped by curiosity, care, and long hours of research. Reader support helps keep it maintained, carefully researched, and open to everyone.
Common failure modes, and how to avoid them
Light leaks in sampling. A single careless moment while opening a tube can erase a young signal. The fix is training and discipline. Open only under safe light and remove the outermost sediment, which may have been exposed.
Bioturbation and mixing. Roots and burrowing animals churn sediments. A mixed layer will produce a broad De distribution that can mask a clear burial event. The fix is field judgment, single-grain measurement, and age models that focus on the well-bleached population.
Saturation in old samples. If quartz is saturated, the growth curve flattens. Feldspar with pIRIR can sometimes extend the range. Otherwise, the sample may be beyond OSL’s reach.
Heterogeneous dose rates. Pebbles, shells, or brick fragments can create micro-dosimetry differences at the scale of a grain. Single-grain data help, but sometimes the best fix is to choose a more uniform layer.
Anomalous fading in feldspar. Use fading tests or pIRIR. If the correction is large and uncertain, temper the weight you give the age in interpretations.
These are not exotic. They are the ordinary things that go wrong with any field method. Knowing them makes the tool stronger.
A plain-language walk-through of a hypothetical case
Consider a sandy layer on the inner slope of an abandoned river meander. The layer lies 3.2 meters below the present surface, beneath a silt cap. The field team sees cross-bedding typical of point-bar deposits and chooses a spot where the lamination is clean and undisturbed. They tap two opaque aluminum tubes, 30 millimeters in diameter, into adjacent laminae, and collect surrounding bulk sediment for dose-rate measurements. The tubes are sealed, labeled with coordinates, depth, and orientation, and transported to the lab.
In the lab, technicians open the tubes under dim orange light, discard the outermost 5 to 10 millimeters, and take sand from the center. After sieving to 90–150 micrometers, they remove carbonates and organics by acid digestion, float heavy minerals to isolate quartz, and give the grains a brief fluorosilicic acid etch to remove the alpha-irradiated outer rim. They mount quartz on discs for single-aliquot SAR.
The reader stimulates the aliquots with blue light, records the natural luminescence, then gives a series of regenerative laboratory doses: 2 Gy, 4 Gy, 8 Gy, 12 Gy, and so on. After each dose, the instrument applies a small test dose to monitor sensitivity changes. The growth curve fits cleanly to a saturating exponential. The natural signal corresponds to a De of 7.3 Gy for the shallower lamina and 8.0 Gy for the deeper one, with small errors and little scatter across aliquots.
Bulk sediment from the tubes is analyzed for uranium, thorium, and potassium. The lab estimates a dry dose rate of 2.2 mGy per year. From the site’s hydrology and the sediment’s texture, they adopt a burial water content of 15 percent by weight, which reduces the effective dose rate to 1.8 mGy per year. The cosmic dose for 3.2 meters of burial at the site’s latitude and altitude is 0.07 mGy per year. Summed and rounded, Dr is 1.87 mGy per year.
Ages are then De divided by Dr. The shallower lamina yields 3.9 thousand years, the deeper lamina 4.3 thousand years, both with uncertainties of about 0.3 thousand years. The age difference fits the stratigraphy, and the magnitudes make sense for the terrace’s position relative to other dated features upstream. The team interprets the point bar as active between about 4.5 and 3.5 thousand years ago, then abandoned as the river shifted.
What “single-grain” really changes
If that same point-bar sand had been deposited during a flood at night, many grains would not have been fully bleached. On an aliquot, leftover signal from just a few poorly bleached grains can inflate De and the age. Single-grain analysis measures hundreds to thousands of grains individually. The resulting De distribution often shows a skew, with a long tail of older De values and a sharp lower mode. The Minimum Age Model estimates the burial dose from that lower mode. In practice, single-grain analysis is more expensive in time and instrument hours, but it pays for itself in contexts where exposure to sunlight was brief or variable.
Single-grain data also highlight micro-dosimetry effects. Grains that sat next to a potassium-rich feldspar clast might show higher De because they experienced a higher beta dose. Separating grains removes that within-aliquot averaging and allows cleaner modeling.
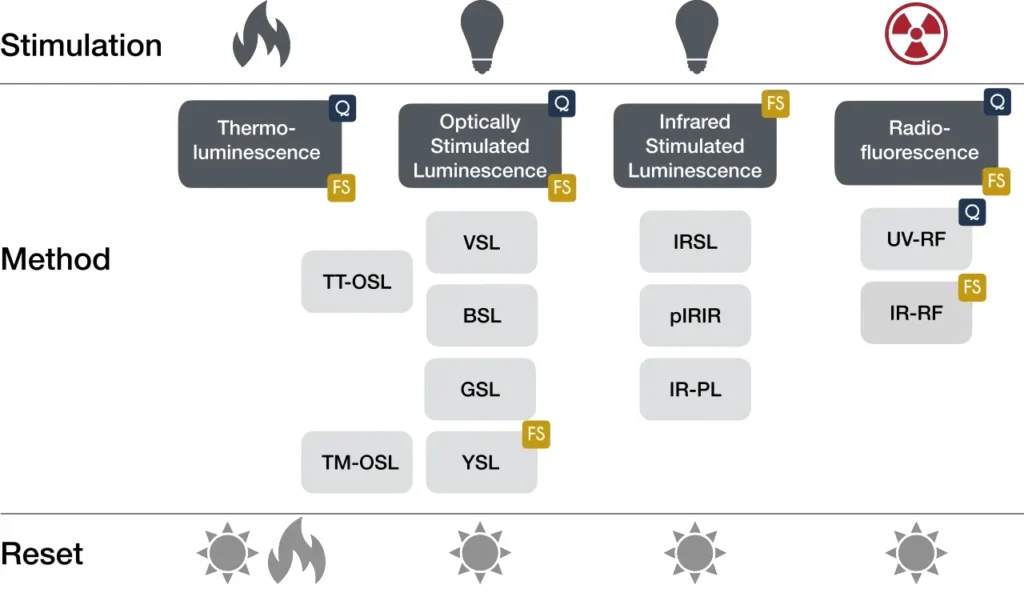
Thermoluminescence, IRSL, and where OSL fits among cousins
Thermoluminescence, or TL, stimulates with heat instead of light. It is the classic technique for dating heated materials such as pottery and bricks. Infrared stimulated luminescence, IRSL, uses infrared light and targets feldspar more directly. OSL, in the narrow sense used by many laboratories, means blue or green light stimulation of quartz. The broader umbrella, optical dating, can include both OSL and IRSL. Together these methods cover a wide set of depositional events.
In a layered sequence, an archaeologist might date a charcoal lens with radiocarbon, a fired floor with TL, a dune cap with OSL, and an overbank silt with either OSL or IRSL, depending on minerals. Agreement among the different clocks raises confidence in the sequence. Disagreement, when it happens, often teaches something about site processes.
Myths and realities about OSL
Myth: OSL can date any sediment.
Reality: OSL dates mineral grains that were exposed to sunlight and then buried. Cave clays deposited in darkness, pond silts protected from light, or heavily mixed layers require careful modeling. Some contexts are simply poor candidates.
Myth: A handful of sand yields a single, exact age.
Reality: A good sample yields a distribution of grain doses. Analysts choose a model that fits the depositional story. The age is a best estimate with a stated uncertainty.
Myth: If a light leaks into the tube for a moment, the sample is ruined.
Reality: The outermost grains will be reset. Labs remove the exposed outer ring and take their analytical material from the protected interior. Severe light leaks can still spoil a sample, which is why field practice matters.
Myth: OSL always agrees with radiocarbon.
Reality: They date different things. OSL dates burial of sediment, radiocarbon dates the death of an organism. In the same layer, they often agree within errors. When they do not, both results and the context need review.
Myth: Instruments are black boxes.
Reality: Modern readers are complex, but the signal they measure is straightforward: photon counts after stimulation, calibrated against doses the instrument itself delivers. Growth curves and interpolations are plotted and checked for each sample.
What OSL dates cannot tell you
OSL does not date when a person made an artifact or when a structure was used, unless the act of making or using involved sunlight or heat. It dates the burial of the grains it measures. If a hearth was built and stones were heated, TL might date the firing. If a path across a dune was made and soon buried by wind, OSL can date the burial, which anchors the event that made the path. If a hearth was reused and ashes were mixed, or a dune surface was trampled weeks before burial, the relationship between OSL and the human event becomes indirect. Matching questions to methods preserves both from misuse.
The lab report, decoded
A typical OSL report includes:
A short summary of context and sampling.
Mineral, grain size, and the number of aliquots or grains measured.
The stimulation wavelengths, the protocol used, and any special tests or corrections.
A De value with uncertainty, and a plot of the growth curve.
Dose-rate components: U, Th, K concentrations, cosmic dose, water content assumptions, and internal dose if applicable.
The final age with one-sigma error, plus a note on the age model used.
Good reports also include a few diagnostic plots: a radial plot of De values, a histogram showing distribution shape, and checks that the test dose normalization behaved well. Together these allow a reader to judge whether the number at the bottom is supported by clean behavior at every step.
Why a detector photo belongs in an OSL explainer
There is a reason luminescence labs talk about their photomultipliers. OSL signals can be very faint. A modern photomultiplier tube multiplies tiny currents created by single photons until they are measurable. The detectors sit behind filters that pass the luminescence wavelengths and block the stimulation light. The combination of darkroom conditions, careful filtering, and sensitive detectors makes it possible to read a whisper of light from a few grains of sand. That whisper, repeated across dozens or hundreds of grains, becomes an age.
Field notes that improve OSL outcomes
Photograph and log the stratigraphy at sampling points with a scale.
Note depth, layer thickness, sediment type, and any visible disturbances.
Collect separate bulk sediment for water content and radioelement measurements.
Minimize delays between sampling and darkroom processing to avoid moisture loss that could matter for water content estimates.
If possible, pair OSL samples with independent markers: volcanic ash, a soil horizon, a dated artifact layer. Cross-checks strengthen interpretation.
OSL is not a vending machine for dates. It is a measured conversation between fieldwork, laboratory procedure, and statistical judgment. The better the notes on site, the more persuasive the discussion later.
Why dunes, footprints, and margins keep showing up in OSL stories
They gather sunlight, then bury. That simple cycle is the heart of OSL. A dune crest spends hours in direct sun. When wind flips the grains over the brink and buries them on the slipface, the clock starts. A lake margin, exposed during a dry period, receives footsteps and ripples of sand in open light. A storm raises the lake and covers the surface. The clock starts. OSL favors places where nature does the reset for you, then preserves the result with a stable blanket of sediment.
In archaeological landscapes, those places are often where people passed, camped, and built. Trails skirt dune toes. Camps sit on levees and floodplains. Shelters open onto slopes where dust settles at night but bright sun sweeps in by day. OSL thrives where sunlight and burial alternate on a human rhythm.
A quick glossary for readers who want to follow lab notes
Aliquot. A mounted subsample containing many grains, measured as a unit.
Single grain. Measurement of one grain at a time.
De. Equivalent dose, a measure of the stored radiation dose in a grain.
Dr. Dose rate, the annual dose delivered by the burial environment.
SAR. Single Aliquot Regenerative dose protocol, the workhorse method for obtaining De.
Saturation. The part of the growth curve where more dose does not increase luminescence.
Anomalous fading. Loss of luminescence signal over time in feldspar at room temperature.
pIRIR. Post-infrared infrared stimulated luminescence, a feldspar protocol that targets more stable signals.
Bleaching. Exposure to light that empties the traps and resets the clock.
Partial bleaching. Incomplete resetting before burial, a common challenge in shaded or rapid-deposition contexts.
These terms show up in methods sections. Knowing them turns a dense paragraph into an understandable story of what the lab actually did.
What a “footprint date” really means
When researchers report that OSL dated a footprint surface, they are reporting the burial time of the sand or silt that sealed the print. If the print formed on an exposed surface and sand buried it soon after, the OSL age anchors the event closely. If the area was disturbed, or if burial lagged by months, the OSL age may date the burial surface rather than the exact moment the foot pressed the ground. That distinction matters. It does not reduce the value of the date, but it defines its meaning. In practice, teams combine OSL with stratigraphic clues, sedimentology, and sometimes radiocarbon from nearby organic material to tighten the interpretation.
A final checklist: when to choose OSL
Choose OSL when your question is “when was this sediment deposited” and your material is quartz- or feldspar-rich sand or silt that saw daylight immediately before burial. Choose single-grain OSL when sunlight exposure might have been brief or variable, or when you see evidence of mixing. Consider feldspar with pIRIR for older deposits where quartz saturates. Pair OSL with other methods whenever you can. The most convincing timelines are braided, not single-stranded.