

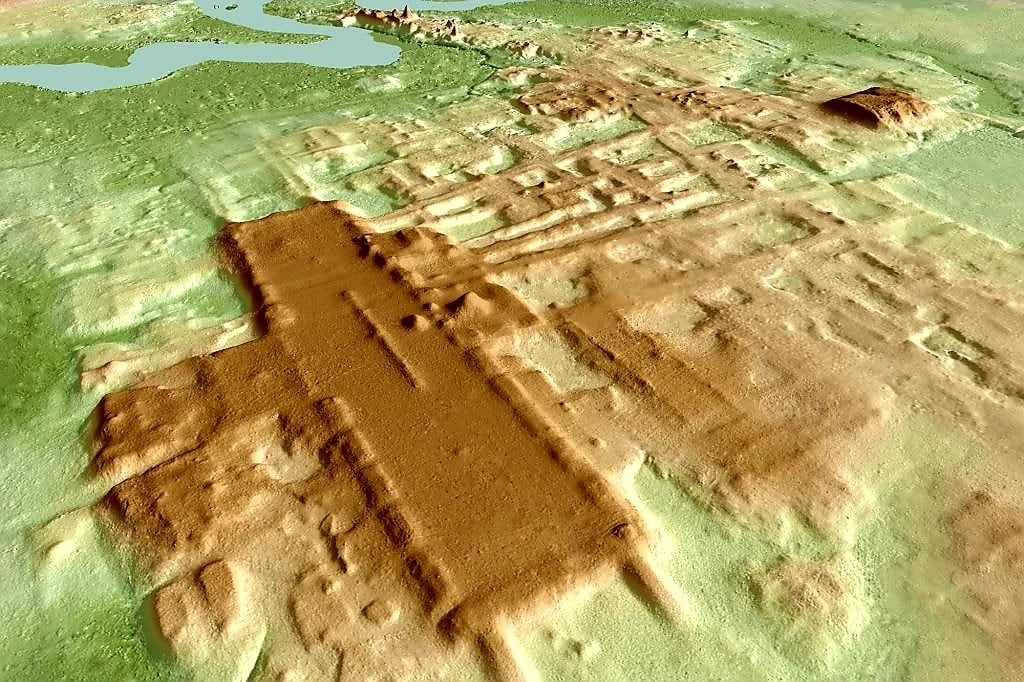
In the summer of 2016, a small aircraft flew a grid pattern over roughly 2,100 square kilometres of the Maya Biosphere Reserve in the Petén region of northern Guatemala, firing laser pulses through the forest canopy at a rate of hundreds of thousands per second. When the data arrived at the University of Houston for processing, a team of researchers including Marcello Canuto, Director of the Middle American Research Institute at Tulane University, and Francisco Estrada-Belli, also of Tulane, stayed at their computers until late into the night watching the jungle peel away. Sixty-one thousand ancient structures emerged from the bare-earth models: isolated houses, large palaces, ceremonial centres, causeways, agricultural terraces, reservoirs, and defensive walls. Canuto later recalled telling the students crowded into the lab that evening that this was the day lowland Maya archaeology changed. He was not wrong. This post traces what the LiDAR Maya surveys have collectively revealed since 2016, what the discoveries mean for our understanding of settlement scale, hydraulics, agriculture, and urban planning, and where the open questions still sit.
What LiDAR actually does and why it matters for the Maya
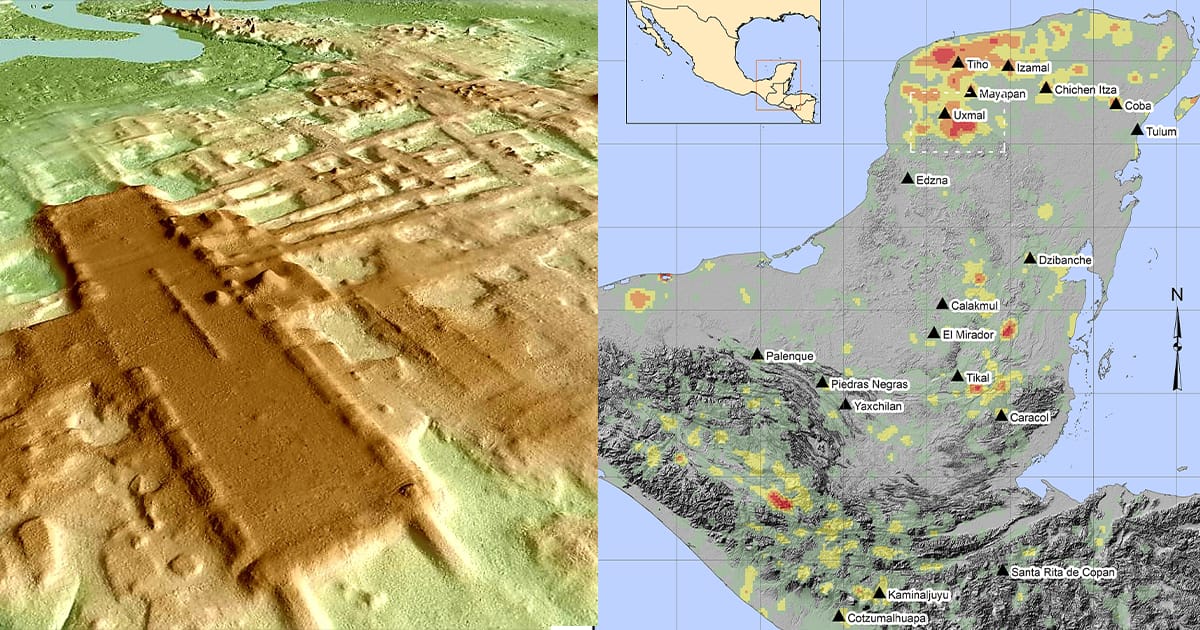
LiDAR stands for Light Detection and Ranging. An aircraft-mounted sensor fires laser pulses downward and records the time each pulse takes to return, which tells the instrument exactly how far it has travelled. Some pulses bounce off canopy leaves and branches. Others slip through gaps and hit the ground. By collecting millions of returns across a survey area and filtering out the vegetation returns, analysts can generate a bare-earth digital elevation model that shows the actual surface of the ground stripped of all plant cover. The result is an elevation map accurate to within roughly 30 centimetres vertically, fine enough to resolve a house platform 50 centimetres high in the middle of a dense tropical forest.
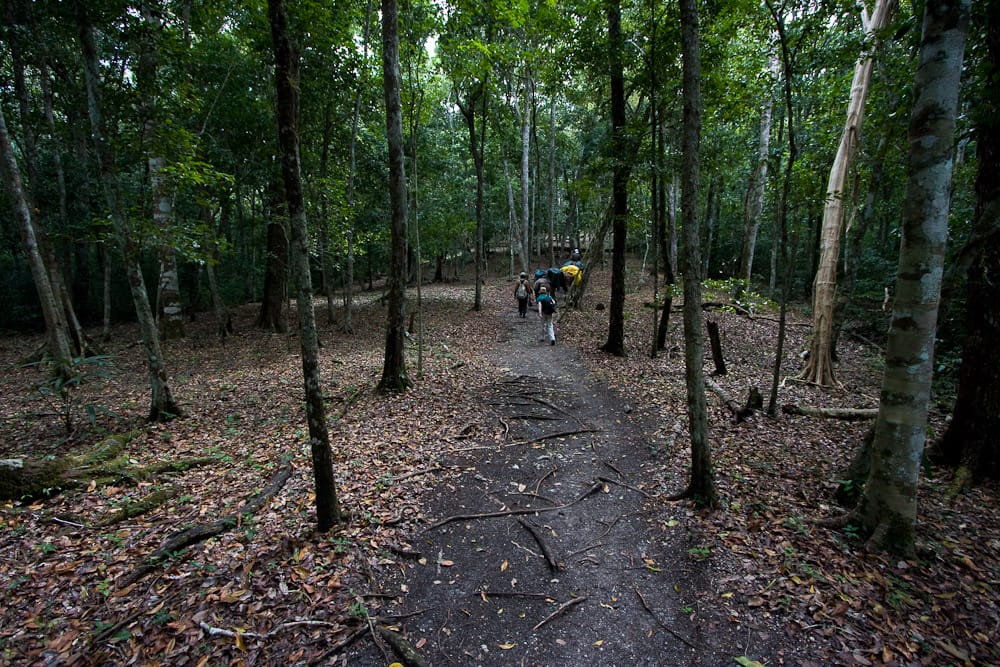
This precision matters in the Maya Lowlands more than almost anywhere else in archaeology, for a specific reason. The Classic-period Maya, who flourished roughly between 250 and 900 CE across southern Mexico, Guatemala, Belize, and Honduras, built in a low-density urban style fundamentally different from the compact walled cities of the Old World or Highland Mexico. Their settlements spread outward rather than upward: residential platforms and patio groups scattered across kilometres of landscape, connected by raised causeways and integrated with terrace agriculture, reservoirs, and drainage systems. On foot, these features are almost invisible, because the vegetation has compressed, obscured, and blended them into the general topography over a thousand years. From the air, stripped of their green cover, they resolve into readable geometry almost immediately.
The PACUNAM LiDAR Initiative (PLI), the consortium led by the Fundación Patrimonio Cultural y Natural Maya and involving eighteen scholarly institutions across Guatemala, the United States, and Europe, was the project that first demonstrated what regional-scale LiDAR could do in this landscape. The NSF National Center for Airborne Laser Mapping at the University of Houston operated the survey aircraft and processed the raw point-cloud data. The results, published in the journal Science in September 2018, were the most comprehensive single LiDAR archaeological dataset ever produced for Mesoamerica and forced an immediate recalibration of population estimates, agricultural organisation, and the spatial logic of Maya political power.
Scale: how large the Maya urban landscape actually was
Before the PLI data arrived, archaeological knowledge of Maya settlement was dominated by intensively excavated flagship sites, Tikal, Copan, Palenque, Calakmul, and a handful of others, surrounded by blank space on regional maps. Survey teams had mapped corridors and tested sample areas around these cores for decades, but the labour of pedestrian survey meant that most of the lowland landscape had never been systematically examined at ground level. The standard assumption was that the areas between major sites were sparsely occupied: secondary centres of modest scale, a thin scatter of rural households, and a lot of undisturbed jungle.
The PLI survey demolished that assumption with specific numbers. Within the 2,100 square kilometres scanned in 2016, the consortium identified 61,480 structures, a figure that implied a total population of between seven and eleven million people in the central lowlands at the height of the Late Classic period, roughly 650 to 800 CE. A 2025 regional study by Francisco Estrada-Belli, Marcello Canuto, Ivan Šprajc, and Juan Carlos Fernandez-Diaz, incorporating LiDAR coverage north of the original survey area, revised that estimate upward to between 9.5 and 16 million, reflecting more complete data across the full central lowlands. Thomas Garrison, then of Ithaca College, who specialized in digital technology in Maya research and was part of the PLI consortium, described the settlement density as having been “grossly underestimated.” The scale comparable, he argued, was not to the scattered small kingdoms European historians had imagined but to the densely organised polities of ancient Greece or Tang dynasty China.
What drove these numbers upward was not the discovery of previously unknown major pyramid complexes. It was the ubiquity of small platforms: the foundations of ordinary pole-and-thatch houses repeated across the landscape in consistent orientations, spaced in clusters around minor civic nodes, connected by paths to fields and to the causeways of larger centres. These are exactly the kinds of features that a pedestrian surveyor might walk past without noticing, because each individual mound is low enough to look like a natural terrain variation. At survey density, as tens of thousands of them emerged from the bare-earth model simultaneously, they stopped looking like scattered debris and started reading as a planned, inhabited landscape maintained across generations.

Causeways: the road network that tied the lowlands together
Raised causeways, called sacbeob (singular sacbe, literally “white road”) in the Yucatec Maya language, were already known from above-ground stone examples in Yucatán, where the Cobá road system includes a 100-kilometre stretch connecting major centres. LiDAR revealed that the earth-and-rubble predecessors of these stone roads were far more extensive in the forested lowlands than anyone had measured, and that they functioned not just as routes between major centres but as organising spines for entire settlement clusters.
In the PLI data and in subsequent surveys around Caracol, Belize, where Arlen Chase and Diane Chase of the University of Central Florida had pioneered LiDAR mapping of a Maya site beginning in 2010, sacbeob show up as slender, slightly elevated linear ridges running for kilometres through the model with a consistency of width and camber that distinguishes them cleanly from natural drainage features. At Caracol, the Chase team documented an internal causeway system connecting the site’s major plazas and extending outward to link outlying residential groups across a mapped urban area of roughly 177 square kilometres, far larger than the site’s ceremonial core had suggested. The causeways carry flanking drainage ditches in stretches where they cross bajo (seasonal wetland) terrain, a hydraulic engineering detail that shows the road construction programme was integrated with the landscape management programme rather than running parallel to it.
The political implications of causeway networks visible at this scale are significant. A road that runs straight for ten kilometres, maintains a consistent raised profile, and is flanked by drainage infrastructure does not appear through informal accumulation. It requires planning, coordinated labour, access to fill material, and an authority capable of directing work across the boundaries of individual residential groups. When multiple such roads converge on a single civic node, as they do at dozens of sites visible in the PLI data, the node’s role as a logistical and political centre becomes physically legible in a way that monument height alone cannot communicate.
Water: the hydraulic infrastructure beneath Maya cities
The Maya Lowlands receive substantial annual rainfall, but it arrives unevenly. Most of it falls between June and October; the dry season from roughly January to May can be severe enough to threaten agriculture and drinking water. The Maya response to this seasonal problem, visible at regional scale in LiDAR data for the first time, was one of the most extensive hydraulic engineering programmes in the ancient Americas. Reservoirs, catchment berms, feeder canals, spillways, and gridded agricultural fields with integrated drainage channels appear across multiple site types and in all three major environmental zones, the upland ridges, the bajos, and the karst basins of northern Yucatán.
At Tikal, Guatemala, the site archaeologists had studied since the 1950s, LiDAR surveys showed that the area immediately surrounding the famous temple complexes was ringed by an interconnected system of reservoirs fed by paved plazas that acted as catchment surfaces. Rainwater running off the ceremonial centre was channelled rather than lost. Vernon Scarborough of the University of Cincinnati, who has studied Maya water management for decades, has argued that control over reservoir access gave Maya elites a physical lever for maintaining authority over populations during dry seasons, when those who maintained and distributed water could extract labour and tribute from those who depended on it. LiDAR makes this argument concrete, because the reservoirs and the elite architecture are now mappable in spatial relationship to one another rather than inferring the relationship from documents alone.
In bajo landscapes, where the terrain is dominated by seasonally flooded depressions, LiDAR reveals a different hydraulic strategy: raised field agriculture, in which platforms of soil were built up above the flood level and separated by drainage canals that doubled as water sources during dry periods. The raised field complexes visible in the northern Petén and in Belize cover areas of tens of square kilometres at individual sites. Causeways crossing the bajos, which read in the LiDAR model as low linear ridges with slightly different elevation signatures from the surrounding muck, often align with raised field complexes in ways that suggest the road and farming infrastructure were planned as an integrated system rather than added to one another incrementally.
Built out of a love for history, kept free from distractions.
Spoken Past is an independent project shaped by curiosity, care, and long hours of research. Reader support helps keep it maintained, carefully researched, and open to everyone.
Aguada Fénix and the Preclassic evidence that rewrites the timeline
One of the most significant findings to emerge from LiDAR surveys in the Maya region came not from the PLI consortium’s focus on the Classic period but from an earlier project in Tabasco, Mexico, led by Takeshi Inomata, Regents Professor of Anthropology at the University of Arizona, and his colleague Daniela Triadan. In 2017, while processing low-resolution government LiDAR data covering roughly 3,000 square kilometres of the western Maya lowlands, Inomata’s team noticed an enormous flat-topped platform that looked like a natural hill from the ground and the air alike. High-resolution targeted LiDAR survey confirmed it as a constructed platform measuring 1,400 metres in length, 400 metres in width, and between 10 and 15 metres in height, with nine causeways radiating outward from its central axis. Radiocarbon dating of 69 charcoal samples established construction between roughly 1000 and 800 BCE, placing Aguada Fénix squarely in the Middle Preclassic period, centuries before the Classic-period kings whose monuments had previously been taken to represent the beginning of monumental Maya construction.
The findings, published in Nature in June 2020, immediately disrupted the standard developmental model of Maya civilisation, which held that social complexity and monumental construction emerged gradually from small agricultural villages over many centuries. Aguada Fénix is not a precursor to Classic-period monuments. It is larger than any Classic-period platform, including those at Tikal and Teotihuacan, and it was built by people who, based on the absence of sculptures of high-status individuals and on settlement evidence suggesting relatively mobile lifeways, probably did not live under the authority of centralised dynasties. Inomata’s interpretation is that Aguada Fénix represents communal construction, a massive shared project organised not by royal command but by voluntary participation coordinated around ritual calendars and astronomical alignments. The monument’s central axis aligns with the sunrise on October 17 and February 24, a 130-day span representing half of the 260-day Mesoamerican ritual calendar.
A subsequent survey using the same government LiDAR data, published in Nature Human Behaviour in 2021, found 478 smaller ceremonial complexes sharing the same rectangular platform form and east-west orientation as Aguada Fénix across the states of Tabasco and Veracruz, demonstrating that this construction tradition was not a local anomaly but a regional phenomenon extending across the boundary between the Olmec and Maya cultural spheres. The revelation of this Preclassic building tradition beneath jungle that nobody had systematically surveyed is the clearest illustration of what LiDAR does to archaeological timelines: it does not merely extend known histories outward, it finds whole chapters that were missing.

Agriculture at urban scale
Agricultural terraces appear around Maya centres in sufficient numbers and at sufficient spatial density in LiDAR surveys to require a fundamental shift in how scholars frame the relationship between farming and urbanism. The PLI 2018 dataset mapped 362 square kilometres of terrace and other modified agricultural terrain within the survey area alone, alongside 952 square kilometres of viable farmland. These are not scattered garden plots at the margins of ceremonial cores. They are continuous worked landscapes integrated with residential compounds, drainage systems, and causeways in ways that can only be read as planned urban infrastructure.
The implication is that Maya cities did not merely sit in a landscape that happened to produce food nearby. The production landscape was part of the city. Field edges align with house group boundaries, suggesting that land allocation was formal and probably governed by the same institutional frameworks that organised house construction and causeway maintenance. Canals serving agricultural fields share their alignment with canals serving the civic centres, suggesting unified management rather than separate agrarian and urban systems that happened to coexist. Understanding the labour investment required to build and maintain this agricultural infrastructure, which the PLI data makes measurable for the first time at regional scale, changes the arithmetic of Maya political economy. Monument construction looks different when you account for the fact that the same polity was simultaneously maintaining hundreds of kilometres of terrace walls, drainage channels, and raised field platforms.
Fortifications and the organisation of political control
LiDAR surveys have revealed defensive infrastructure across the Maya Lowlands at a scale and consistency that changes how scholars interpret Maya political geography. Ditches, earthen ramparts, palisade berms, and gated causeway entries appear around ridges, passes, and water sources in the PLI data and in site-specific surveys. These features are characteristically broad and low, exactly the profile that makes them invisible on foot and obvious in a bare-earth elevation model. The PLI consortium identified extensive defensive earthworks across the 2016 survey area, a volume that previous pedestrian survey work had given no reason to expect.
The spatial logic of the defensive features, when mapped against the causeway network and the reservoir system, is revealing. Defensive earthworks cluster at topographic chokepoints: ridge crests, river crossings, and the approaches to major reservoir complexes. A polity that controlled a ridge controlling a causeway could levy tribute or deny passage. A polity that controlled the main reservoir system of a bajo basin had leverage over every community dependent on that water during the dry season. LiDAR allows archaeologists to map these relationships between defensive infrastructure, road networks, and hydraulic systems simultaneously and at regional scale, which means the territorial logic of Maya political power can now be read from the landscape directly rather than inferred entirely from inscriptions.
Francisco Estrada-Belli, whose work at the Holmul site in Petén gave him a decade of experience with Maya settlement before the LiDAR era, described the fortification evidence as one of the PLI’s most surprising outputs. His team had been excavating at El Zotz, also in northern Guatemala, for years and had produced careful pedestrian maps of the area. The LiDAR survey revealed a 9-metre fortification wall at El Zotz that the team had never located during those years on foot. The wall had been there the entire time. It simply could not be seen.

What LiDAR does not answer and where the debates still sit
LiDAR data does not come with dates attached. A platform visible in a bare-earth model is precisely that: a platform of unknown age, function, and construction history. The PLI consortium was careful to distinguish between the 61,480 structures it mapped and the much smaller subset that had been excavated and dated. Population estimates derived from structure counts carry significant uncertainty because they require assumptions about contemporaneity, about how many structures were in use at any given time, and about average household size, all of which vary across time and space and are themselves the subjects of ongoing scholarly debate.
A 2025 study published in the Journal of Archaeological Science: Reports, by Francisco Estrada-Belli, Marcello Canuto, Ivan Šprajc, and Juan Carlos Fernandez-Diaz, used combined archaeological and environmental LiDAR data from across the central lowlands, including coverage north of the Guatemala–Mexico border that the 2018 PLI survey did not reach, to build new regional population density estimates. Rather than qualifying the high-density settlement picture, the paper challenged the standing assumption of a more dispersed, rural northern Maya pattern and proposed a uniform model of settlement organization across both urban and rural zones throughout the Classic-period central lowlands extending the 2018 argument rather than complicating it. This kind of cumulative, region-wide refinement is precisely what the PLI dataset was built to sustain.
Responsible LiDAR archaeology also carries ethical obligations that the field is actively working through. Regional visibility makes it apparent that ancient infrastructure crosses modern agricultural land, community territories, and international boundaries. Publishing survey data openly enough for independent scholarly review while masking precise locations of fragile or looted sites is a genuine tension with no universal solution. The PLI consortium has shared data with the Guatemalan Ministry of Culture and Sports and worked to involve Guatemalan institutions and descendant communities in decisions about access and conservation, a model that other projects have begun to follow but that remains inconsistently applied across the discipline.
Primary sources and key studies: Marcello Canuto et al., “Ancient lowland Maya complexity as revealed by airborne laser scanning of northern Guatemala,” Science, Vol. 361, Issue 6409, 2018; Takeshi Inomata et al., “Monumental architecture at Aguada Fénix and the rise of Maya civilization,” Nature, Vol. 582, 2020; Francisco Estrada-Belli et al., “Lidar survey of northern Guatemala’s Maya Biosphere Reserve,” Tulane University press release, 2018; Francisco Estrada-Belli et al., “Ancient Maya wealth and status mapped via vaulted structures,” Journal of Archaeological Science, 2023, coverage at Tulane University News; Francisco Estrada-Belli, Marcello A. Canuto, Ivan Šprajc, and Juan Carlos Fernandez-Diaz, ‘New regional-scale Classic Maya population density estimates and settlement distribution models through airborne lidar scanning,’ Journal of Archaeological Science: Reports, Vol. 66, October 2025